
In this illustration, the Parks & Recreation Department as a whole is shown with a 2018 budget of $12,328,000 to achieve an overall departmental goal measuring citizen satisfaction with the city's park and recreation facilties and programs, at a cost not to exceed a certain amount per resident. A separate line-item budget is also provided, showing how the money will be spent by the Department. As this first table shows, this budget amount includes $4,438,080 to achieve a certain level of citizen satisfaction with the park grounds and facilities of the city.
.jpg)
As the second table (below) shows, this $4,438,080 budget amount has been cascaded down to the Park Grounds and Facilities Division, which has three Programs for helping to meet the Division's citizen satisfaction goal. One of these Programs relates to maintaining the picnic areas, with a budget of $454,100 to meet several of its own performance goals.
.jpg)
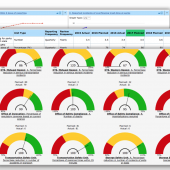
For many local governments, these first two tables (above) would illustrate a sufficient degree of Performance Budgeting. These two tables together do provide a good view of the relationship between spending and results, structured to show how lower-level program activities link to higher-level program outcomes. However, some organizations may wish to take the cascading one more step, to show the actual unit cost of certain program activities. The third table (below) illustrates the relationship between a program's cost-per-unit of activity (relating to workload measures) and the direct result of the activity. This type of unit-cost measurement can be done on a selective basis if desired (i.e., not for most program activities), by focusing just on those activities where tracking changes in efficiency is considered especially useful. In those cases, the performance budget tables would likely show the activity's unit costs over each of the past several years (though not shown in this illustration).
.jpg)
Information and insight on revolutionizing government transparency and accountability
This web site provides information and insights, including examples, about Performance Based Budgeting/Management in government. Much of the information applies generally to any government at any level anywhere.
It also includes items relating specifically to the U.S. Federal Government, including implementation of the Government Performance and Results Act of 1993 (GPRA), but which may be useful background for managers and staff at other governments.
Because of the great amount of interest in Performance-Based Budgeting by governments both within the US and internationally, this web site deals with this particular reform in some detail.